Viewing road weather forecast
 | The timeline below the graph only affects what is visible on the map, not in the graph itself. |
- In the main menu, to go Map.
-
Select a cast sensor or a road weather forecast point on the map.
Cast sensors are marked as circles and road weather forecast points are marked as squares. A graph showing measurements from the past 24 hours and a forecast for the next 24 hours appears below the map. -
The list of parameters on the left depends on what is measured at the selected point.
For example, selecting Temperature shows details on the temperature measurements from the past 24 hours and a forecast for
the next 24 hours.
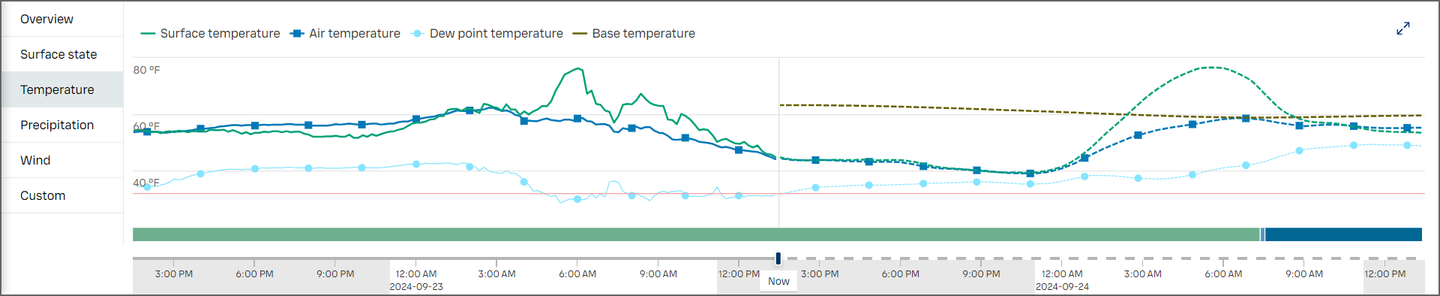

Hover over the graph with the cursor for a detailed view. By default, the time period is set to 24 hours, but it can be changed to 72 hours with the toggle button above the map.

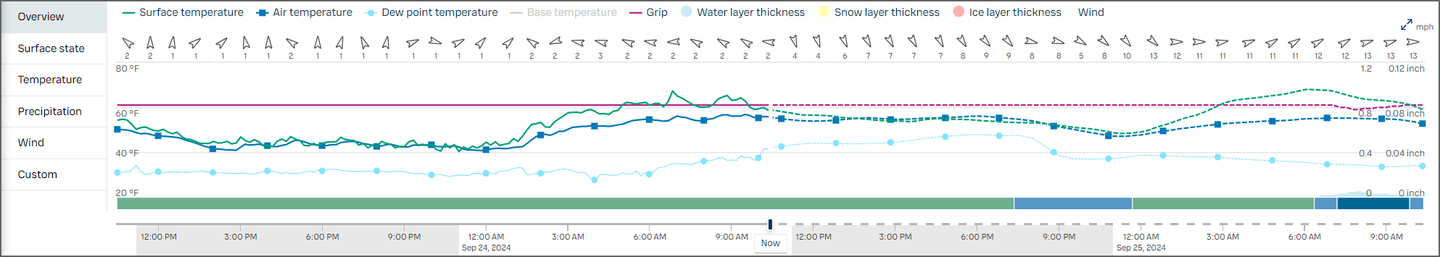
You can hide or make parameters visible by selecting them in the legend above the graph.
Overview includes the most commonly used data all in one graph.
- Segments update every 30 minutes
- Road weather forecast points update every 10 minutes
- Weather stations update every 10 minutes