Using the timeline
The timeline is located at the bottom of the screen and is visible in Map, Station summary, and Image wall, as well as individual graphs.
The length of the timeline depends on the time span selected with the toggle at the top. If 24 is selected, the timeline goes from -24 hours to +24 hours. If 72 is selected, the timeline goes from -24 to +72 hours. This selection also affects what is visible in the graphs.

By default, the time displayed at the top right is the current time. When going forwards or backwards using the timeline, the time displayed at the top right will change accordingly.

To view past observations and assessments, drag the time indicator to the left. The view updates to display the data available at that specific time.
To view forecast data, drag the time indicator to the right.
 | The time displayed at the top right is the same as the time selected in the timeline. |
 |
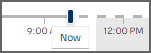
After looking at past or forecast data, select the Now button to automatically go back to the current time.
|
| When viewing current data, the page updates every minute to display new data. However, viewing past or future data stops the page from updating. Select Now to start the automatic updates again. |