Using the dashboard
The dashboard offers a summary of the most
important information relating to the current and future condition of your network for
planning and managing weather events.
 | The 24/72 toggle at the top affects the data displayed in the dashboard. |
| The region or route selected at the top affects what is visible in the dashboard. You can only select one region or route at a time. |
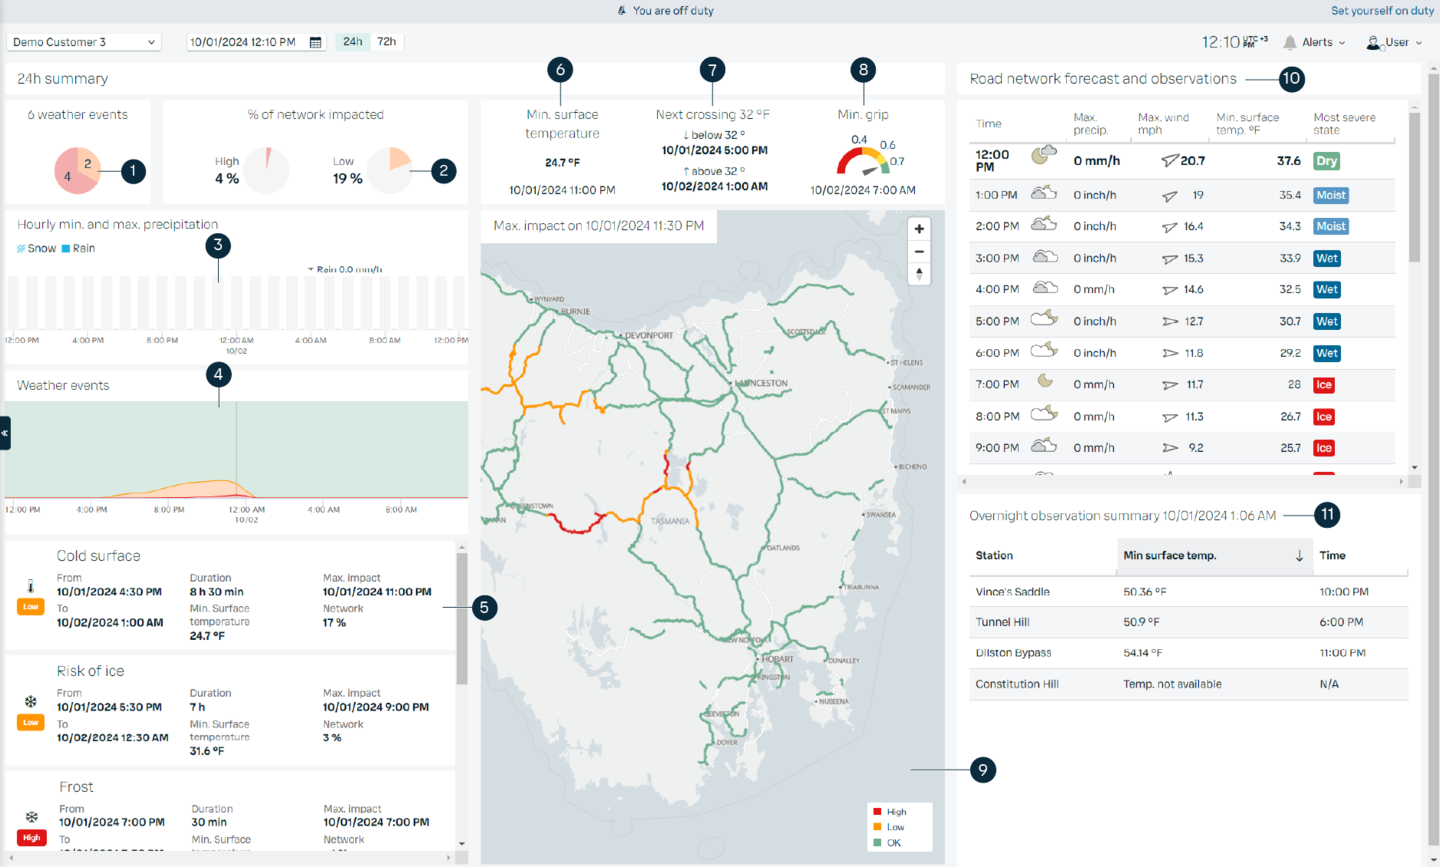
- 1
- Number of ongoing and upcoming weather events and their level of severity
- 2
- Percentage of entire network or stations impacted by weather events
- 3
- Minimum and maximum precipitation and type across all stations or network
The black horizontal line indicates the minimum amount of precipitation. Hover over the graph for more details. It is recommended to use millimeters rather than inches for the layer thickness so that small amounts of rain are easier to read. To edit the units, in the main menu go to . - 4
- Timing and coverage of all weather events combined by severity. The higher the peak, the more of your network is impacted at that time.
- 5
- List of ongoing and upcoming weather events ordered by starting time. Select a weather event to view it in details on the map.
- 6
- Lowest surface temperature and its time of occurrence
- 7
- Time when any segment or station goes below 0 °C, and time when all segments or stations rise and stay above 0 °C
- 8
- Minimum grip and time of occurrence
- 9
- Visualization of maximum impact time and how the network or stations are affected by weather events
- 10
- Hourly forecast displaying the worst weather conditions for each hour among the stations or road segments
- 11
- List of ongoing and upcoming weather events on routes. Select a route to view it in details on the map.