Viewing current data on map
 | The availability of layers depends on your subscription level. |
- In the main menu, go to Map.
-
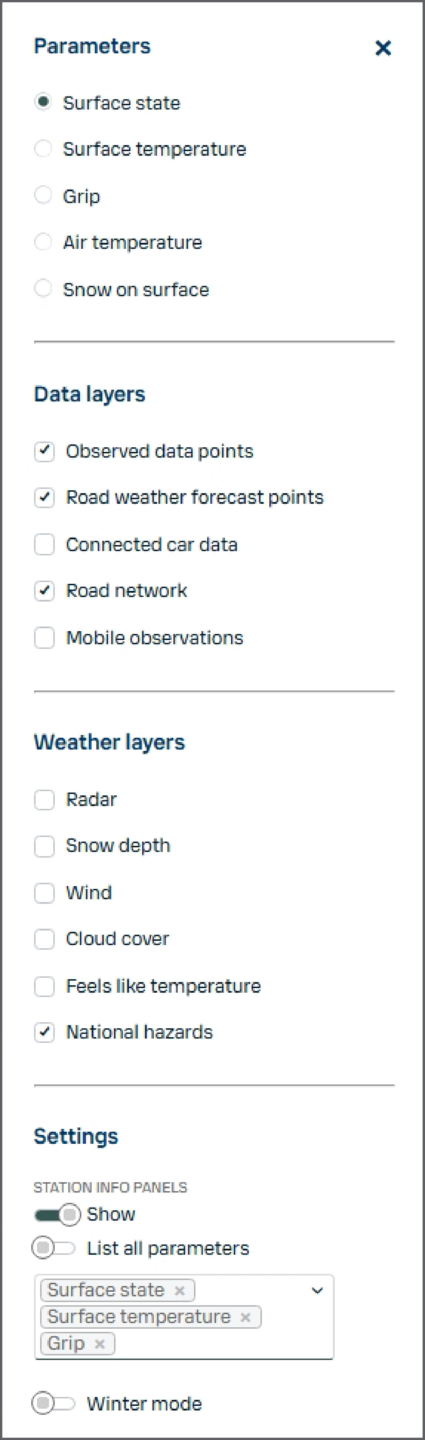
In the Parameters panel, activate layers to display information. These layers consist of key
decision-making parameters, and define what type of observations are displayed with the
different colors. Only one can be selected at a time:
- Surface state
- Surface temperature
- Grip
- Air temperature
- Snow on surface: Amount of snow on the road or runway affected by other factors, such as melting, removal by traffic, and evaporation
-
The Data layers include:
- Observed data points: Cast sensors and weather stations reporting data (represented as circles on the map)
- Road weather forecast points: Locations for which Xweather Horizon models a road weather assessment and forecast (represented as squares on the map)
- Connected car data: Data collected from sensors on connected consumer vehicles
- Road network: Network specific to your organization
- Mobile observation: Mobile observations made with sensors that have been designed specifically to measure winter condition
-
The Weather layers include:
- Radar: Precipitation movement and intensity
- Snow depth: Total snow on the ground
- Wind: Wind direction and speed
- Cloud cover: Satellite data of cloud cover
- Feels like temperature: Temperature perceived by humans taking heat index into account
- National hazards: National weather warnings
Observed data points only display observations from the sensors. For example, if the Surface state status layer is selected and a sensor does not have this parameter, the observed data point will show as gray on the map and say No data.