Creating and editing custom graph
- In the main menu, go to Map.
-
Select an observed data point or a road weather forecast point on the map.
The graph view opens at the bottom.
-
In the graph list on the left, select Custom.
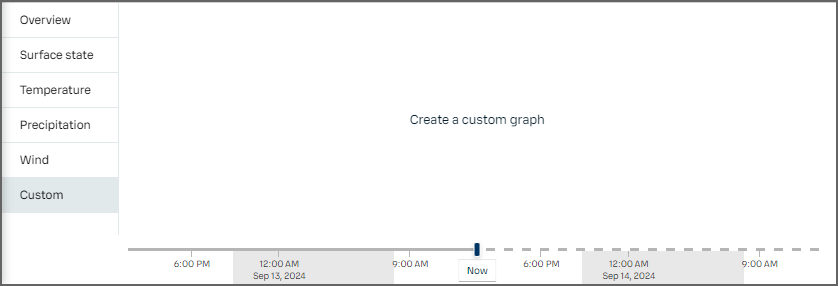
-
Select Create a custom
graph.
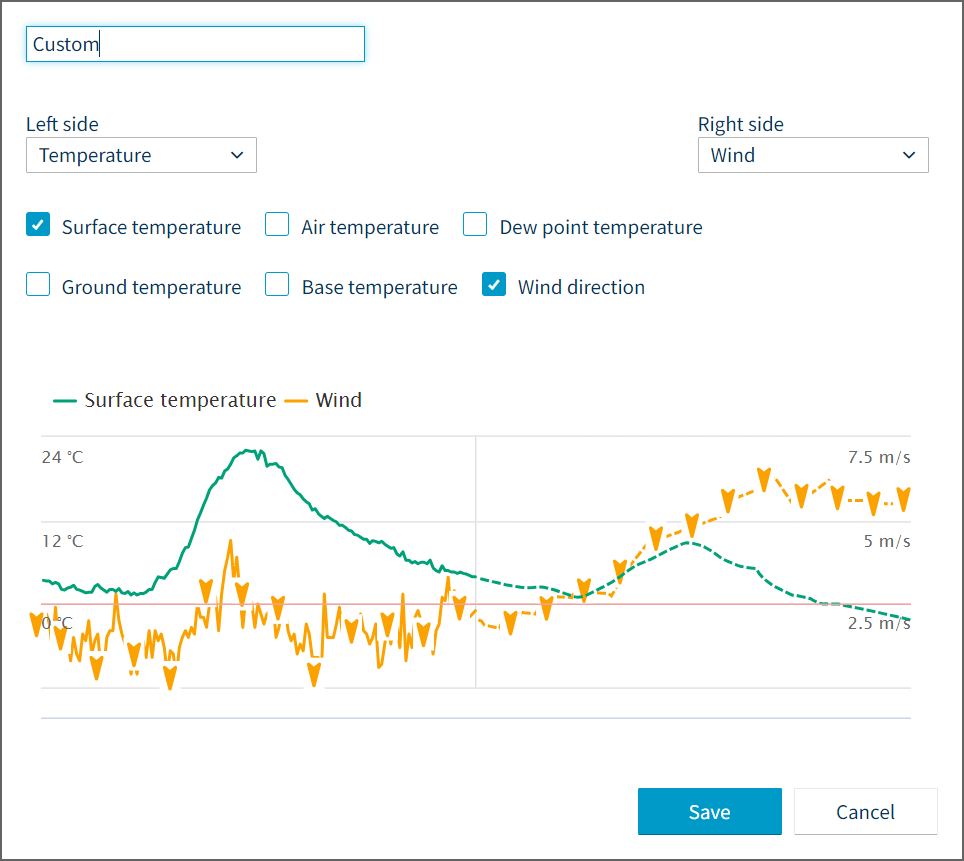
- Optionally, type a new title. Custom is the default title.
- A maximum of two different categories of data can be visualized at once on the y-axis in the graph. Select the desired categories under Left side and Right side. The category selected under Left side is displayed on the left of the graph, and the category under Right side is displayed on the right of the graph. Select the desired parameters to display using the check-boxes.
- Select Save.
- To edit the graph, select the custom graph from the graph list, and select the cogwheel icon at the top right.